A pdf version of this document is available here.
KEI Research Note 2010:5
December 23, 2010
Differences in ratio of deaths to new cases for 6 cancer types in 14 WHO regions, with reference to income of region
Introduction
Cancer is a major health problem. According to the World Health Organization (WHO), cancer was responsible for approximately 13 percent of all deaths in 2007, and about 72 percent of all cancer deaths occurred in low- and middle-income countries. Even with advances in science, the WHO projects an increase of 51 percent in the number of cancer deaths by the year 2030. This research note examines one measure of the disparities in access to cancer treatments — the differences in the ratio of annual cancer deaths (mortality) to new cases of cancer (incidence), in the year 2004.[1] , and considers those differences in the context of differences in average per capita incomes between the 14 WHO regions.
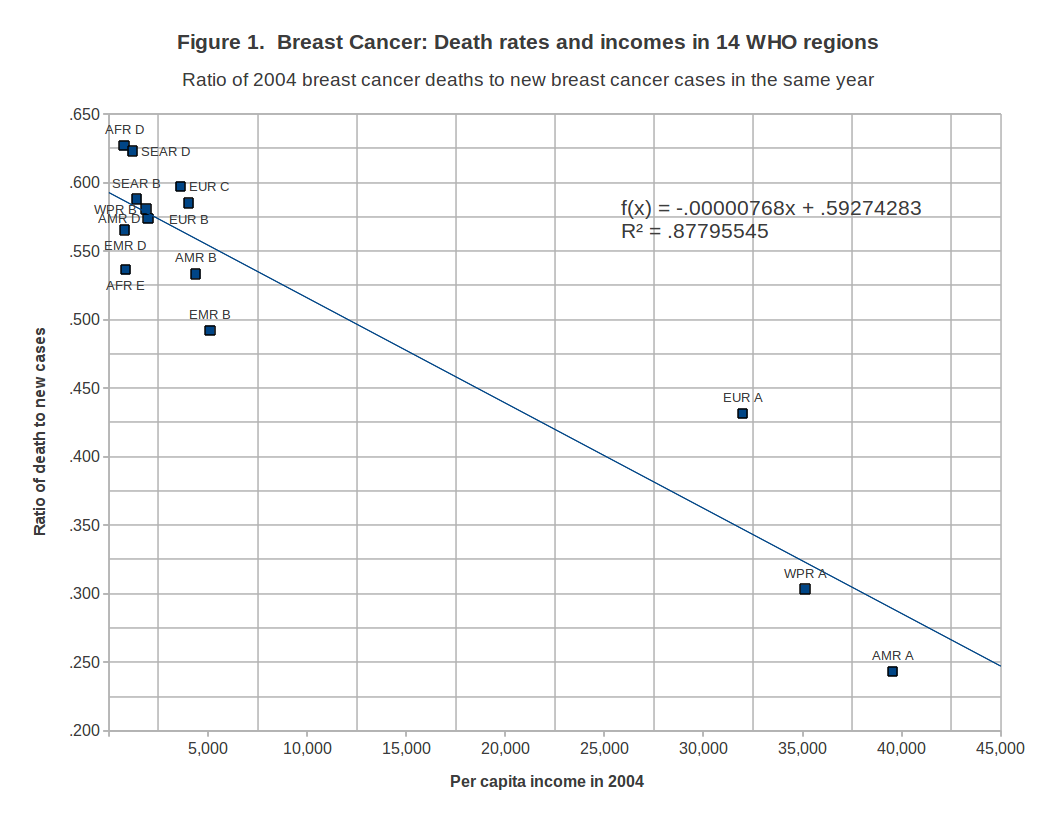
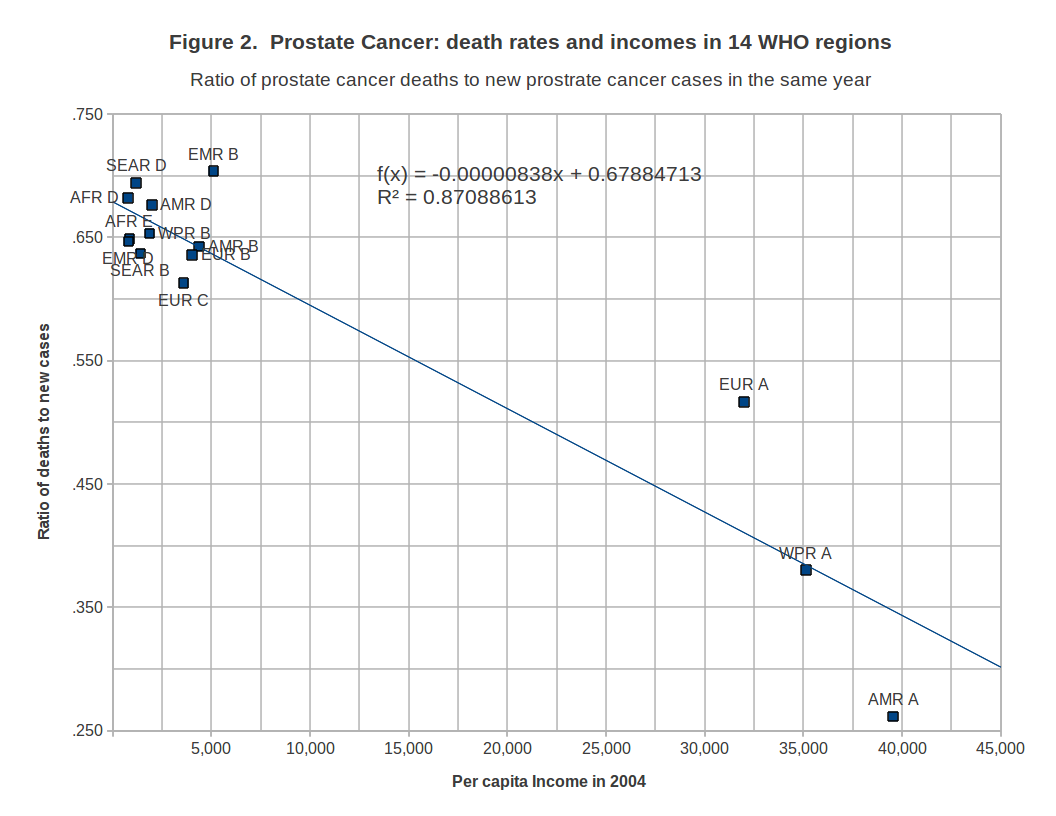
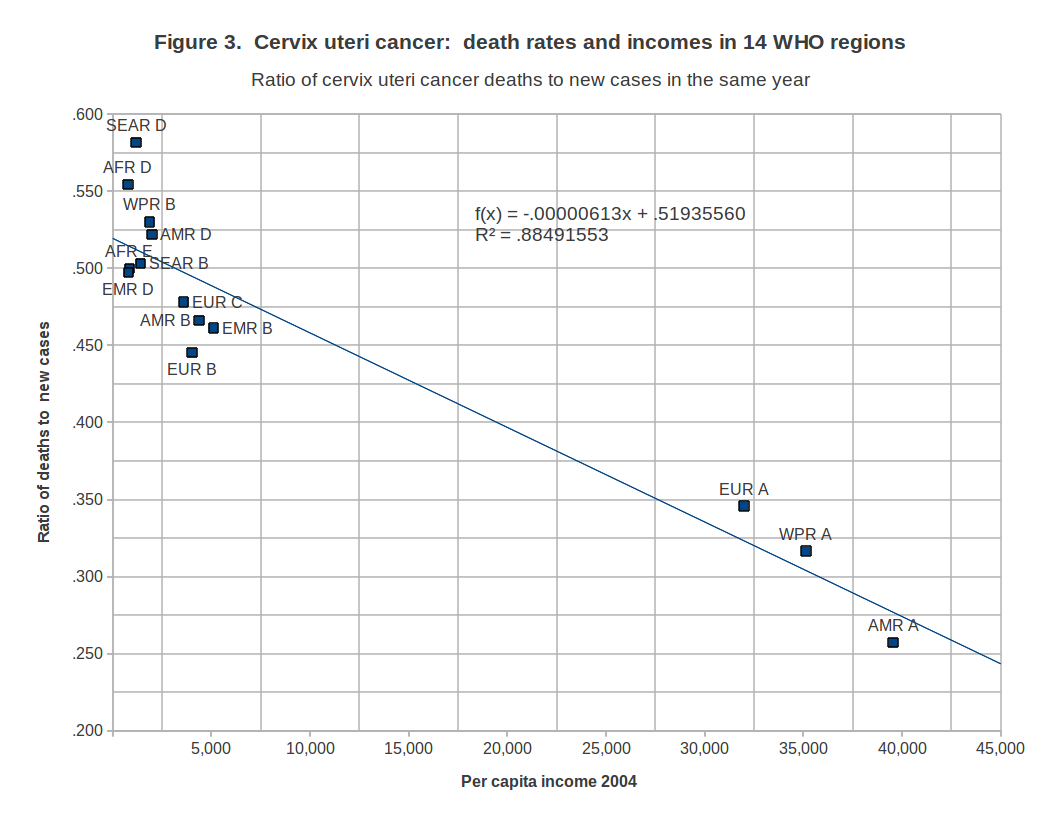
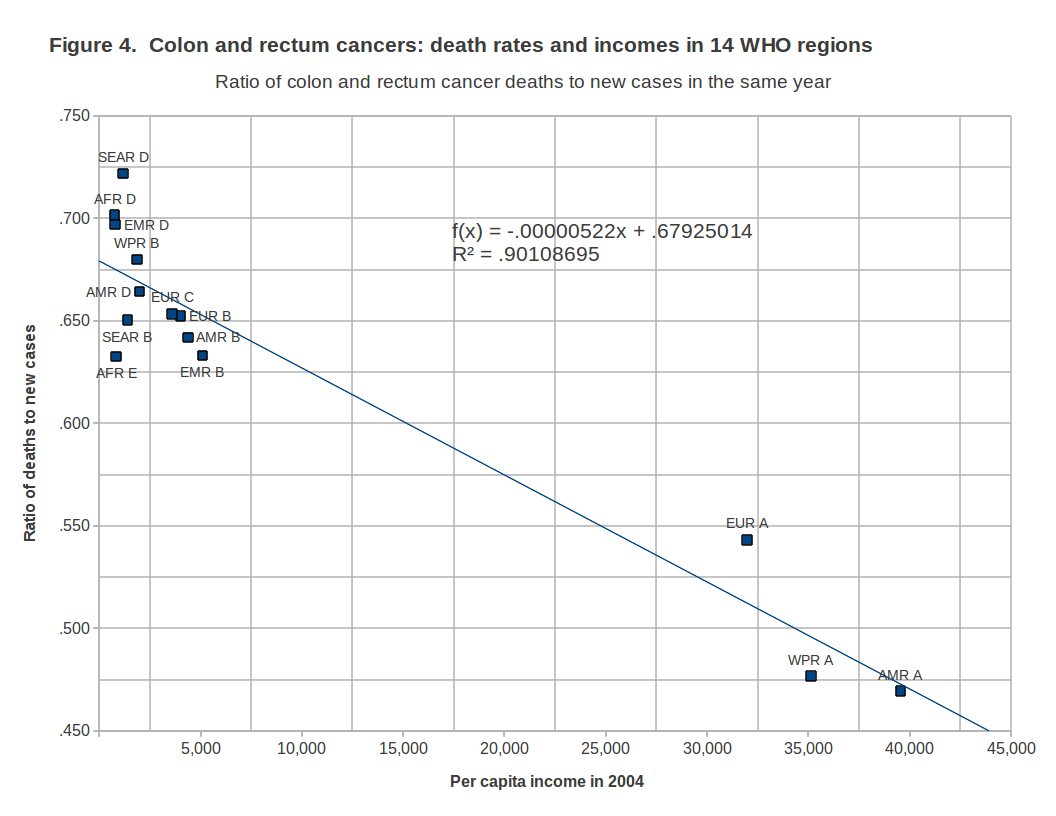
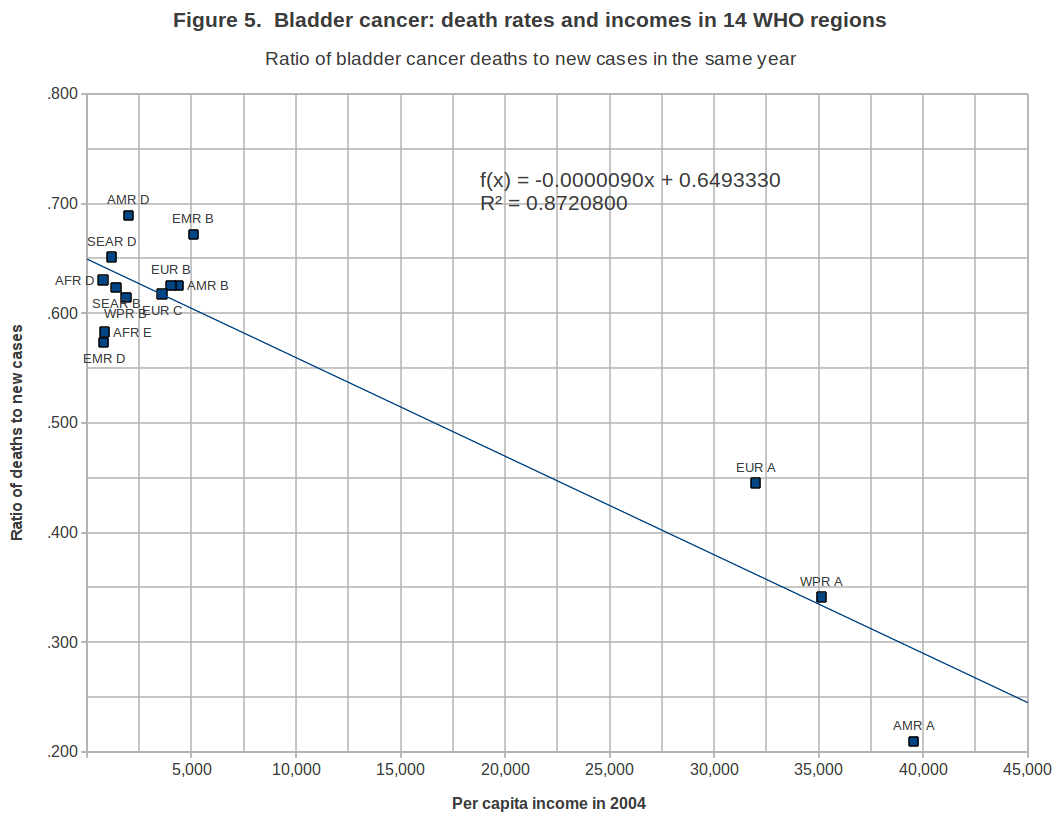
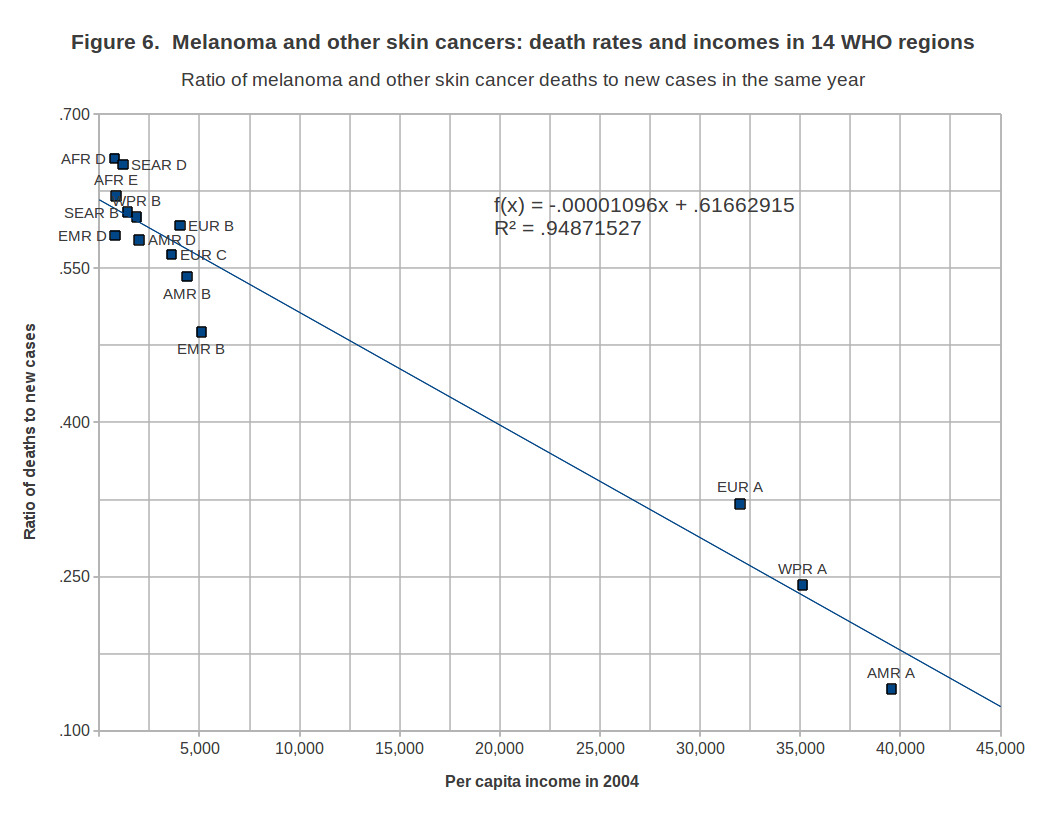
For the six cancer types examined below, the WHO regions with the higher incomes had considerably lower ratios of deaths to new cases. For the six cancers, this relationship is very robust, for both high and lower income WHO regions. As noted elsewhere, ratios of deaths to new cases may be less pronounced for other types of cancer, including in particular those types of cancers that are not associated with long survival rates. [2]
The data on annual cancer deaths and new cases of cancer does not address all areas where disparities of outcomes are important. For example, the data does not consider the life expectancy of persons diagnosed with cancer, or the availability of effective palliative care for persons who have cancer, and thus is highly likely to understate the degree to health disparities.
It is not surprising that incomes matter when it comes to outcomes for cancer patients, and some of the reasons for these disparities are well known, such as the unequal access to diagnostics, care and new drugs.
The challenge for the public health community is to implement policy changes that will reduce these disparities, including not only strengthening of health systems in lower income countries, but also supporting access to newer patented inventions for diagnostics, treatment and care, and implementing new paradigms to finance and encourage research that focus on diagnostics, treatments and care that are useful in resource poor settings.[3]
Data
Table 1 presents the ratio of 2004 deaths (mortality) to new cases (incidence), for six types of cancer in 14 WHO regions. “The ratio of mortality to incidence represents the approximate fatality for a given cancer.”[4]
The calculations presented below are based upon the estimates of incidence and deaths reported in the World Health Organization publication: “The global burden of disease: 2004 update.”
As the data presented is the ratio of reported deaths to new cases, a high number is associated with a high risk of death, and a lower number is associated with a lower risk of death. The six cancer types presented in the table are among those for which significant disparities in outcomes exist among countries of different incomes. [5]
| Countries in region | WHO Region (2004 per capita income*) | Colon and rectum cancers | Breast cancer | Cervix uteri cancer | Prostate cancer | Bladder cancer | Melanoma and other skin cancers |
| All | WORLD | .592 | .472 | .497 | .509 | .479 | .309 |
| Algeria, Angola, Benin, Burkina Faso, Cameroon, Cape Verde, Chad, Comoros, Equatorial Guinea, Gabon, Gambia, Ghana, Guinea, Guinea-Bissau, Liberia, Madagascar, Mali, Mauritania, Mauritius, Niger, Nigeria, Sao Tome and Principe, Senegal, Seychelles, Sierra Leone, Togo | AFR D ($760) | .702 | .627 | .554 | .682 | .630 | .657 |
| Botswana, Burundi, Central African Republic, Congo, Côte d’Ivoire, Democratic Republic of the Congo, Eritrea, Ethiopia, Kenya, Lesotho, Malawi, Mozambique, Namibia, Rwanda, South Africa, Swaziland, Uganda, United Republic of Tanzania, Zambia, Zimbabwe | AFR E ($841) | .633 | .536 | .500 | .649 | .583 | .620 |
| Canada, Cuba, United States of America | AMR A ($39,543) | .469 | .243 | .257 | .262 | .210 | .141 |
| Antigua and Barbuda, Argentina, Bahamas, Barbados, Belize, Brazil, Chile, Colombia, Costa Rica, Dominica, Dominican Republic, El Salvador, Grenada, Guyana, Honduras, Jamaica, Mexico, Panama, Paraguay, Saint Kitts and Nevis, Saint Lucia, Saint Vincent and the Grenadines, Suriname, Trinidad and Tobago, Uruguay, Venezuela (Bolivarian Republic of) | AMR B ($4,375) | .642 | .533 | .466 | .643 | .625 | .542 |
| Bolivia, Ecuador, Guatemala, Haiti, Nicaragua, Peru | AMR D ($1,978) | .664 | .574 | .522 | .676 | .689 | .578 |
| Bahrain, Iran (Islamic Republic of), Jordan, Kuwait, Lebanon, Libyan Arab Jamahiriya, Oman, Qatar, Saudi Arabia, Syrian Arab Republic, Tunisia, United Arab Emirates | EMR B ($5,092) | .633 | .492 | .461 | .704 | .672 | .488 |
| Afghanistan, Djibouti, Egypt, Iraq, Morocco, Pakistan, Somalia, Sudan, Yemen | EMR D ($792) | .697 | .566 | .497 | .647 | .573 | .582 |
| Andorra, Austria, Belgium, Croatia, Cyprus, Czech Republic, Denmark, Finland, France, Germany, Greece, Iceland, Ireland, Israel, Italy, Luxembourg, Malta, Monaco, Netherlands, Norway, Portugal, San Marino, Slovenia, Spain, Sweden, Switzerland, United Kingdom | EUR A ($31,978) | .543 | .431 | .346 | .517 | .445 | .321 |
| Albania, Armenia, Azerbaijan, Bosnia and Herzegovina, Bulgaria, Georgia, Kyrgyzstan, Poland, Romania, Serbia and Montenegro, Slovakia, Tajikistan, The former Yugoslav Republic of Macedonia, Turkey, Turkmenistan, Uzbekistan | EUR B ($4,019) | .652 | .585 | .445 | .636 | .625 | .592 |
| Belarus, Estonia, Hungary, Kazakhstan, Latvia, Lithuania, Moldova, Russian Federation, Ukraine | EUR C ($3,597) | .653 | .597 | .478 | .613 | .617 | .564 |
| Indonesia, Sri Lanka, Thailand | SEAR B ($1,393) | .650 | .588 | .503 | .637 | .623 | .605 |
| Bangladesh, Bhutan, Democratic People’s Republic of Korea, India, Maldives, Myanmar, Nepal, Timor-Leste | SEAR D ($1,176) | .722 | .623 | .582 | .694 | .651 | .651 |
| Australia, Brunei Darussalam, Japan, New Zealand, Singapore | WPR A ($35,122) | .477 | .303 | .316 | .380 | .341 | .242 |
| Cambodia, China, Cook Islands, Fiji, Kiribati, Lao People’s Democratic Republic, Malaysia, Marshall Islands, Micronesia (Federated States of), Mongolia, Nauru, Niue, Palau, Papua New Guinea, Philippines, Republic of Korea, Samoa, Solomon Islands, Tonga, Tuvalu, Vanuatu, Viet Nam | WPR B ($1,865) | .680 | .581 | .530 | .653 | .614 | .600 |
* World Bank estimates of 2004 population and Gross National Income, for all countries in each region for which data exists.
Appendix
Notes
[1] 2004 is the most recent year were mortality and incidence is available for all 14 WHO regions.
[2] Cancer: Annual deaths compared to new cases in 2004, for 16 types of cancer and 4 World Bank income groups.
[3] See, for example, PROPOSAL by Bolivia, Suriname and Bangladesh, Prizes as a Reward Mechanism for New Cancer Treatments and Vaccines in Developing Countries, April 15, 2009.
[4] Parkin, Max D., Pisani, Paola, and Ferlay J., “Global Cancer Statistics,” CA Cancer Journal for Clinicians, 1999:439:33-64. Page 33.
[5] Cancer: Annual deaths compared to new cases in 2004, for 16 types of cancer and 4 World Bank income groups.