Draft, revised April 12, 2016.
2015:4 KEI Briefing Note: The Tufts estimates of the risk adjusted out-of-pocket costs to develop a new drug.
April 12, 2016
James Love
This is a briefing note on the 2016 Tufts study titled: Innovation in the pharmaceutical industry: New estimates of R&D costs, co-authored by three industry consultants, Joseph A. DiMasi, Henry G. Grabowski and Ronald W. Hansen. [J.A. DiMasi et al. Journal of Health Economics 47 (2016)].
I have been asked a few times to explain how the 2016 Tufts/DiMasi/Grabowski/Hansen paper gets its $2.6 billion number. I’ll walk people through a few of their calculations to explain the way the authors estimate the risk adjusted out-of-pocket costs to develop a new drug.
We start with Table 2, where the Tufts paper presents the only real data they have, which are for clinical trial costs, based upon a confidential sample that remains highly opaque. These data are presented in the first column as the averages for the trials, by phase. The last column in Table 2 is the “expected cost of the trials.”
| Testing phase | Mean cost | Median cost | Standard deviation | Standard error | Number of trials | Probability of entering phase (%) | Expected cost |
| Phase I | 25.3 | 17.3 | 29.6 | 3 | 97 | 1 | 25.3 |
| Phase II | 58.6 | 44.8 | 50.8 | 6.6 | 78 | 0.5952 | 34.9 |
| Phase III | 255.4 | 200 | 153.3 | 34.1 | 42 | 0.2114 | 54 |
| Total | 114.2 |
What the authors have done in their Table 2 is look at the costs from each drug that enters clinical testing. The authors present the expected costs as lower than the average costs for Phase 2 and Phase 3, because not all drugs in Phase 1 enter Phase 2 testing, and not all drugs in Phase 2 enter Phase 3 testing. I think the hazard rates for drugs entering each phase are reasonable, and together with the assumption regarding the overall rate of success, they can be used to show the risks and the estimated dollar value of failed trials, at each Phase, in the Tufts analysis.
In the text of the paper, the authors provide two other important parameters. They assume that .1183 of all drugs that begin clinical testing are eventually successful, and, with a much larger leap of faith, use an important assumption to estimate pre-clinical costs. The authors of the Tufts study assume that once risks are taken into account for the combined costs of trials and pre-clinical outays, 30.8 percent of costs for both trials and pre-clinical outlays are assigned to pre-clinical tests. The authors actually have no data of their own on pre-clinical outlays, so the second assumption is particularly worth questioning, and certainly worth questioning when the government pays for pre-clinical R&D. What this means is that pre-clinical costs are estimated to be (.308/(1-.308)) = .445 of the risk adjusted costs of clinical trials — for every drug in the study, regardless of who actually did or paid for the pre-clinical R&D.
What we will do next is show how the 2016 Tufts study describes the average costs of trials, the costs of failures, the ratio of out-of-pocket to risk adjusted costs, and the likelihood of approval (LoA) at each phase.
| Phase | Cost of trials | Cost of trial failures | Risk adjusted trial costs | Ratio of risk adjusted to out of pocket costs | LoA by Phase |
| Phase 1 | $25.3 | $188.6 | $213.9 | 8.45 | 0.1183 |
| Phase 2 | $58.6 | $236.4 | $295.0 | 5.03 | 0.1988 |
| Phase 3 | $255.4 | $201.1 | $456.5 | 1.79 | 0.5587 |
| Totals | $339.30 | $626 | $965.30 | 2.85 |
The authors calculate the pre-clinical costs, not from project level data, but as a fraction of the average risk adjusted trial costs: .308/(1-.308) x 965.3 clinical costs = $430 million.
Are those numbers reasonable? I think the risk parameters, including the likelihood of approval by phase, are reasonable for some drugs, although they seem too low for biologic drugs, where the likelihood of approval for each phase has been estimated to be significantly higher, and also for some diseases. [For more comparisons, see the BIO estimates, published here: Nature Biotechnology 32, 40–51 (2014) doi:10.1038/nbt.2786].
I don’t think it is reasonable to claim $339.3 million as the AVERAGE spent on trials to develop a new drug. And, of course, all of the rest of the 2016 Tufts estimate of drug development costs flow from and depend upon this.
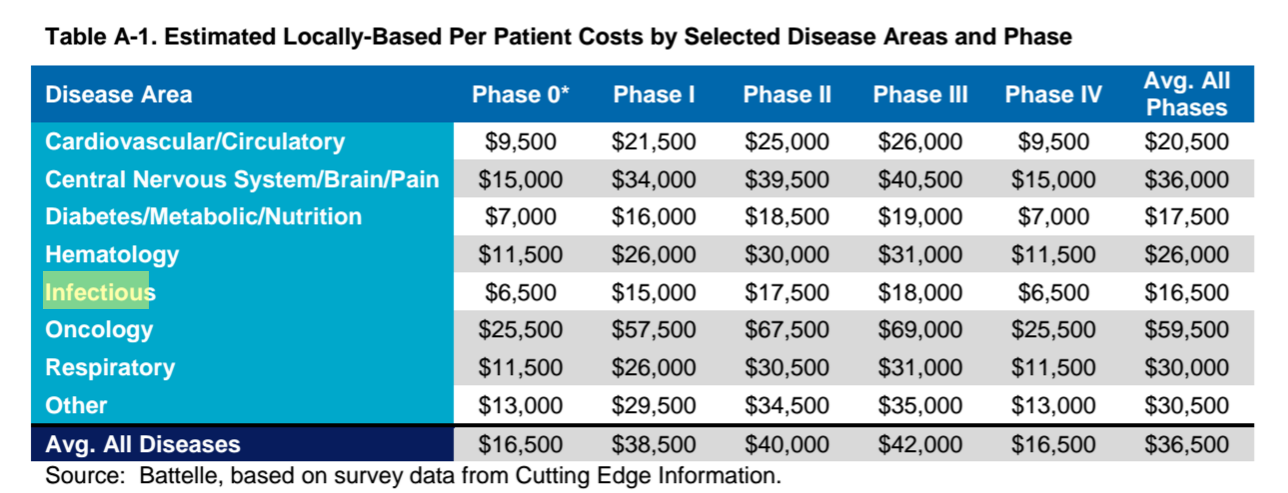
One thing that the authors and the critics of the 2016 Tufts study need to do is compare what DiMasi and his co-authors claim are average trials costs to other observable data from trials. PhRMA recently published a study by Battelle that estimated the average per patient clinical trial cost at $36,500 (see Table A-1 from that study below). For cancer drugs, the figure was $59,500. For infectious diseases, it was $16,500. For drugs that are approved on the basis of a few hundred or a few thousand patients, as is the case for most cancer drugs, the Tufts estimates seem meaningless and highly inaccurate.
The authors of the Tufts study could clear things up by revealing a few key parameters from the confidential database of clinical trial costs, including the number of patients and the cost per patient for the trials they report. So far, they have refused to do so, and that refusal is contributing to much confusion over what they are actually estimating.
I also think people have to realize that the pre-clinical numbers are just an assumption by DiMasi and others, and not based upon any project level data. This is also significant because once the high cost of capital adjustments are made, the Tufts authors assign $1.098 billion as the cost of pre-clinical research, and this is basically an assumption, since they have no project level data, and it ignores the actual facts for every drug in their sample. This how the authors explain clinical costs:
Given the estimates of out-of-pocket and capitalized clinical cost per approved new drug noted in Section 5.4 and the pre-human expenditure to total R&D expenditure ratio, we can infer pre-human out-of-pocket and capitalized costs per approved new drug of $430 million and $1098 million, respectively.
One interpretation of this number is that the value of pre-clinical research, licensed from the NIH or a university, has a value to the company of about $1 billion, on average, in terms of lower pre-approval R&D costs. But probably a better approach is to acknowledge that the authors were unable to make any estimates of pre-clinical costs from project level data collected from companies.
Other important issues in the 2016 Tufts study concern the cost of capital, which the authors estimate to be the rate of inflation plus 10.5 percent — which they apply on a compound basis for all investments incurred before approval — and the omission of R&D subsidies from the analysis, including the orphan drug tax credit, which is a 50 percent subsidy for qualifying trials, and which was relevant to some extent for 47 percent of new drug approvals in 2015. We will take a deeper look at these issues in subsequent commentary.
* Using the Battelle/PhRMA estimates for trial costs by Phase, for infectious diseases.
Annex
Below is Table A-1, from “Biopharmaceutical Industry-Sponsored Clinical Trials: Impact on State Economies,” Prepared by Battelle Technology Partnership Practice for Pharmaceutical Research and Manufacturers of America (PhRMA), March 2015.